
Sensitivity Analysis visualized in seconds.


Product highlights
01
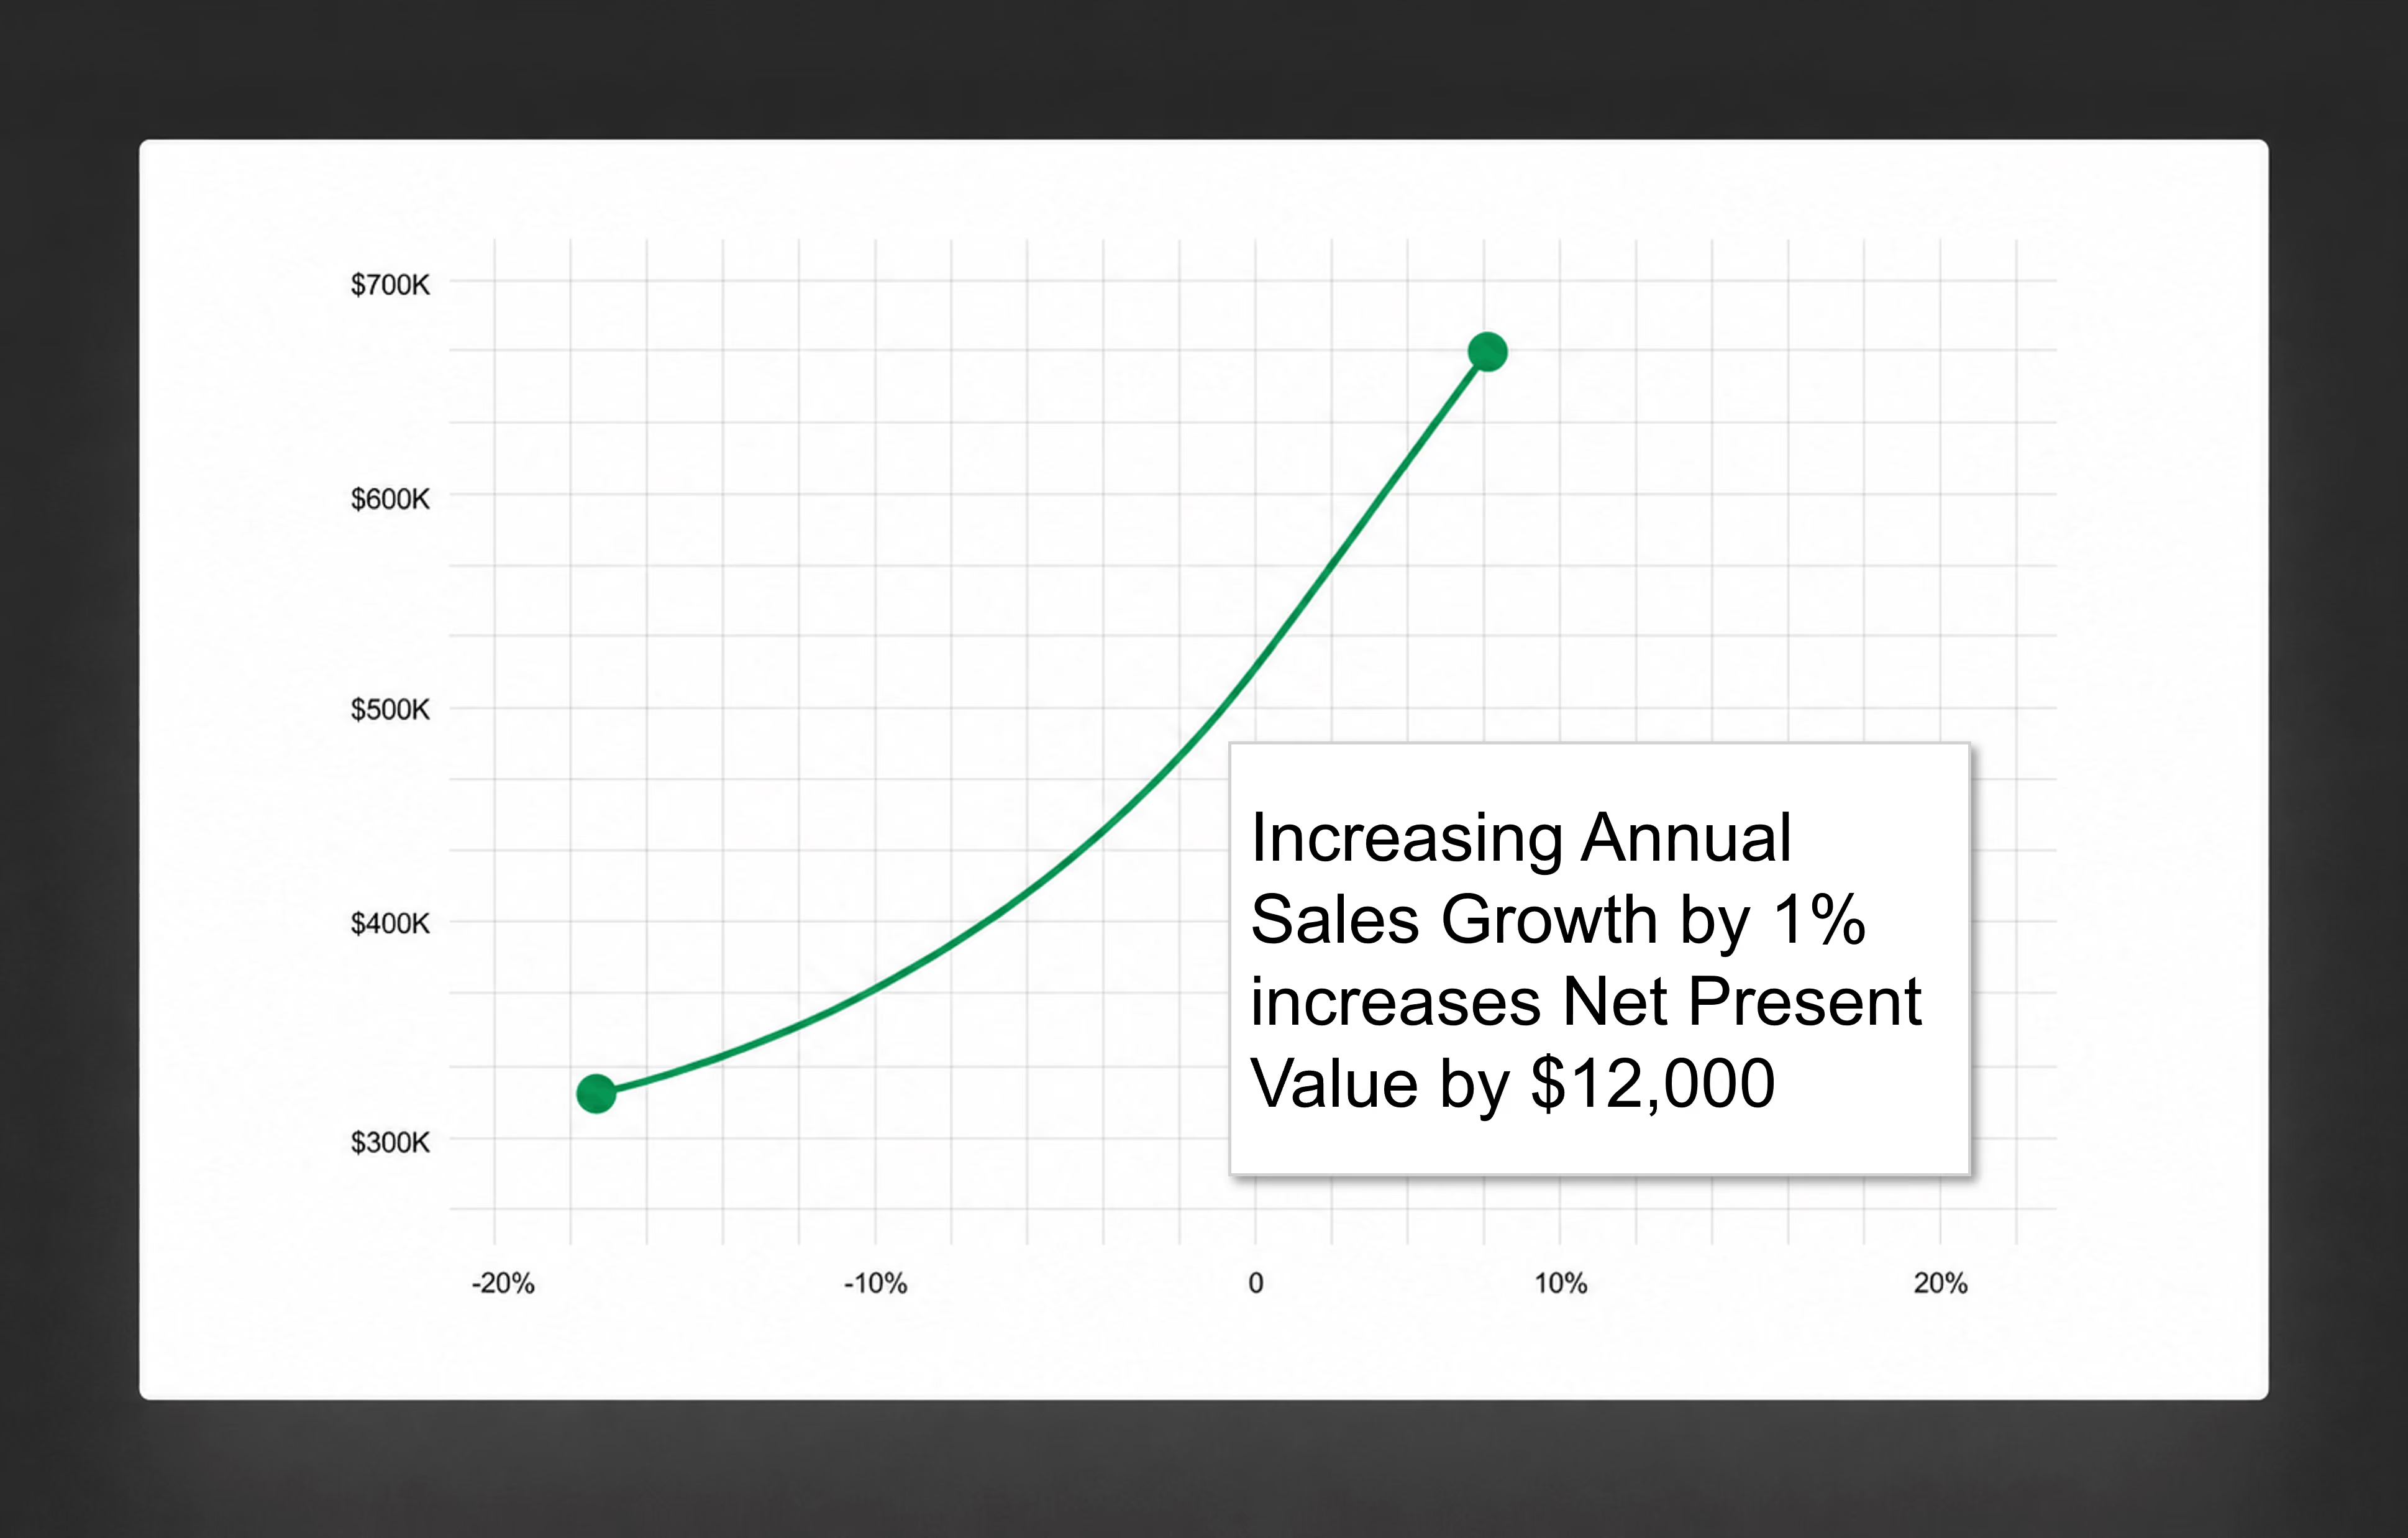
Input Effects Summarized in Seconds
Obtain insights.
Uncover trends.
02
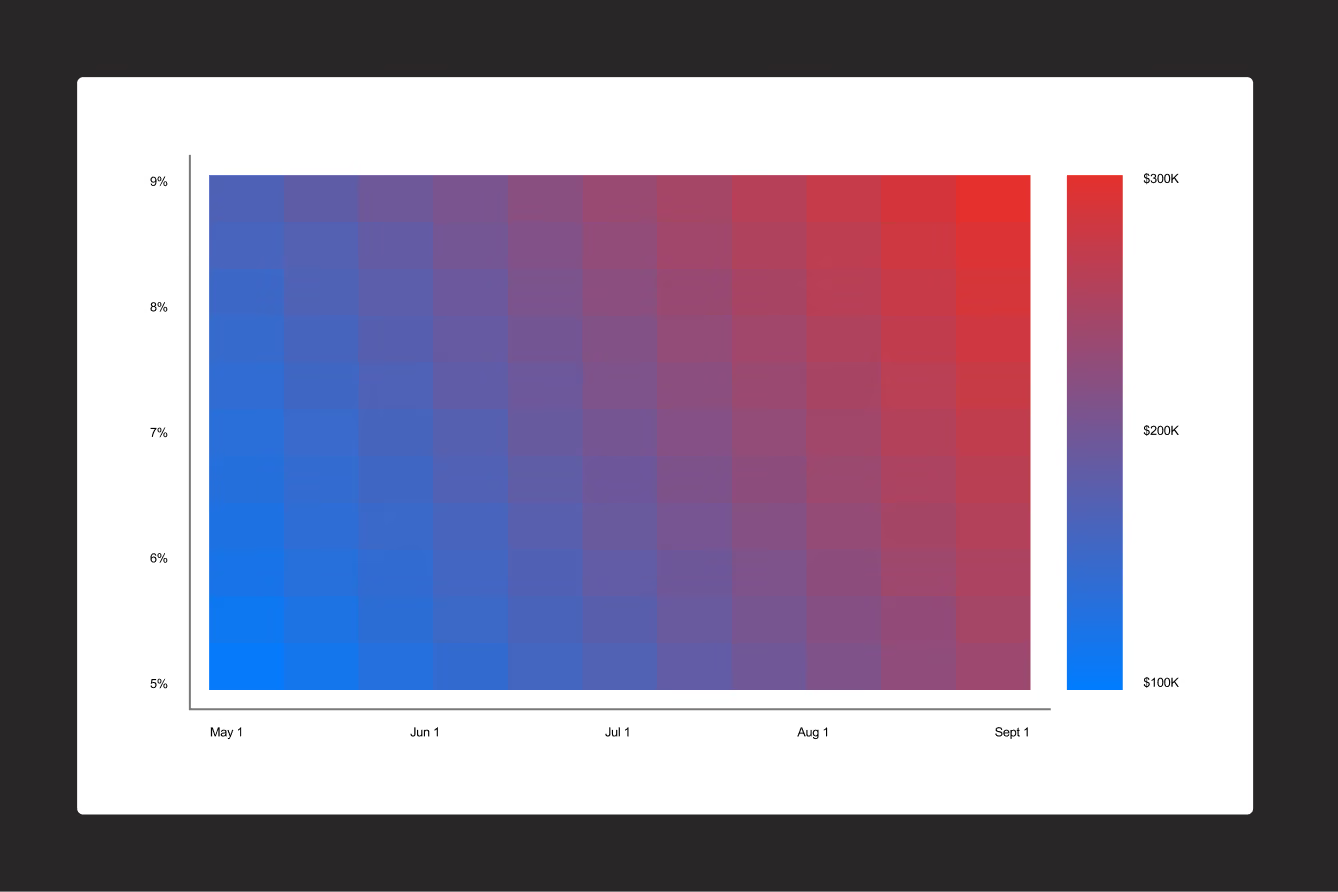
Input Interactions Graphed in Seconds
Visualize driving factors in two dimensions.
Don't miss important dependencies.
03
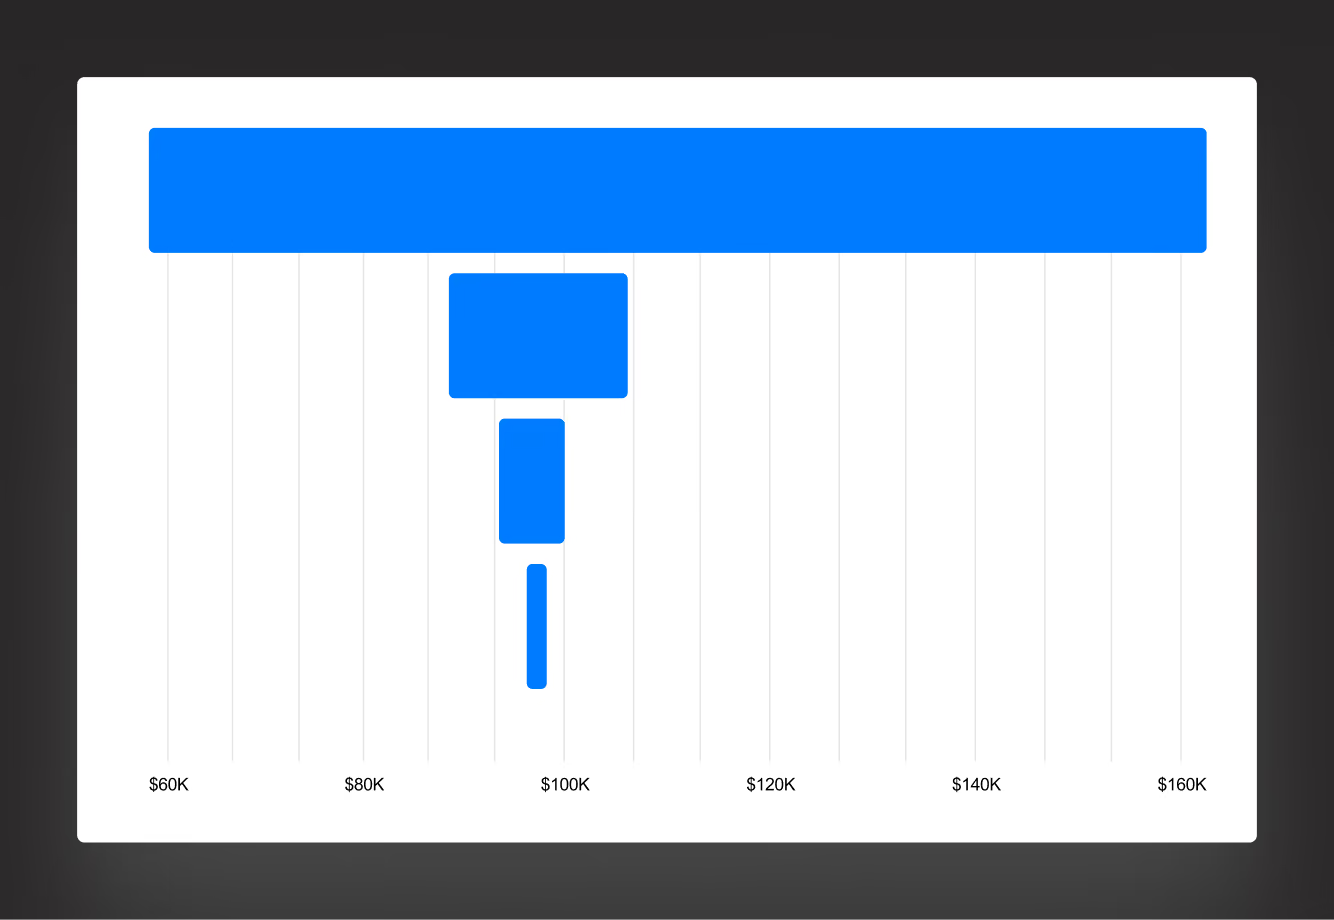
Driving Factors Compared in seconds.
Spot the biggest impacts at a glance.
Gauge the relative importance of model assumptions.
04
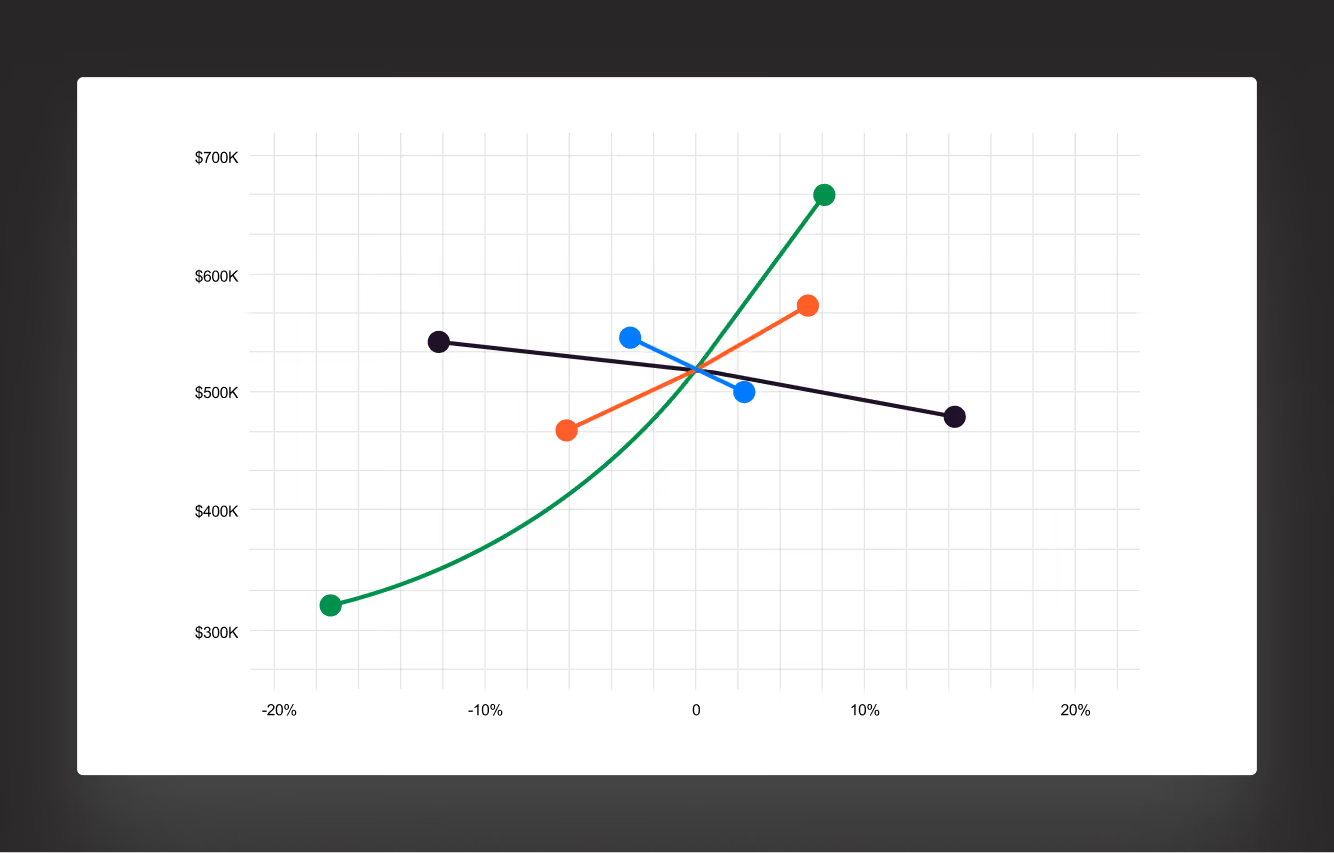
Possible Risks Identified in Seconds
Pinpoint outliers instantly.
Understand model dynamics graphically.
Identify key areas requiring mitigation strategies.
05
Smart Assistant At Your Fingertips
Let the Smart Assistant identify the inputs.
Let it suggests appropriate types of analyses.
Never sends your model over the Internet.


About Us
01
Foundation
Polished Analytics was founded by Erik Westwig and Mirek Janusz, two friends and long-time colleagues. Together, we have close to 50 years of experience developing innovative solutions for Excel.
02
Mission
Our mission is to empower financial analysts and other Excel modelers by offering them a new generation of tools. We provide user-friendly software that allows you to complete critical tasks in seconds, instead of hours.
03
Philosophy
We believe software should be self-documenting: jump in, start using and get results in seconds. When we design software, our focus is on easy-to-read, visually attractive results.

Erik
Westwig
Software Architect, President, and Co-Founder of Polished Analytics
I like working at the intersection of design, mathematics, and software development. With Polished Analytics, I’m excited to bring my vision of powerful, user-friendly Excel tools to life.
I've been building Excel software since 1995. I got my start as a software architect at Palisade Corporation, an early pioneer of Excel-based analytical tools, including the widely used simulation package @RISK.

Mirek
Janusz
Software Architect, Chief Operating Officer, and Co-Founder of Polished Analytics
I love designing and building elegant interfaces that turn complexities into a smooth user experience with no learning curve.
I’ve been building Excel software since 2000. I got my start at Palisade Corporation; there I was the architect of some key components of @RISK and the DecisionTools Suite, popular tools used by analysts all over the world.

Testimonials
01
“Very user friendly and intuitive. Tornado graphs are great.”
- Michael Rees
Professor of Finance, Audencia Ecole Supérieure de Commerce à Nantes
Author of The Essentials of Financial Modeling in Excel (and other books)
02
“A very simple and powerful Excel add-in toolkit for sensitivity analysis.”
- Eric Torkia
Executive Partner, Technology Partnerz Ltd. (clients include Oracle, the U.S. Department of Energy, and Bombardier)
Author of Decision Superhero